Warning: include(/home/c9205967/public_html/kanamoto.ne.jp/include/menu_50annual_en.php): Failed to open stream: No such file or directory in /home/c9205967/public_html/kanamoto.ne.jp/en/pub/50/annualreport/03/index.html on line 95
Warning: include(): Failed opening '/home/c9205967/public_html/kanamoto.ne.jp/include/menu_50annual_en.php' for inclusion (include_path='.:/opt/alt/php82/usr/share/pear:/opt/alt/php82/usr/share/php:/usr/share/pear:/usr/share/php') in /home/c9205967/public_html/kanamoto.ne.jp/en/pub/50/annualreport/03/index.html on line 95
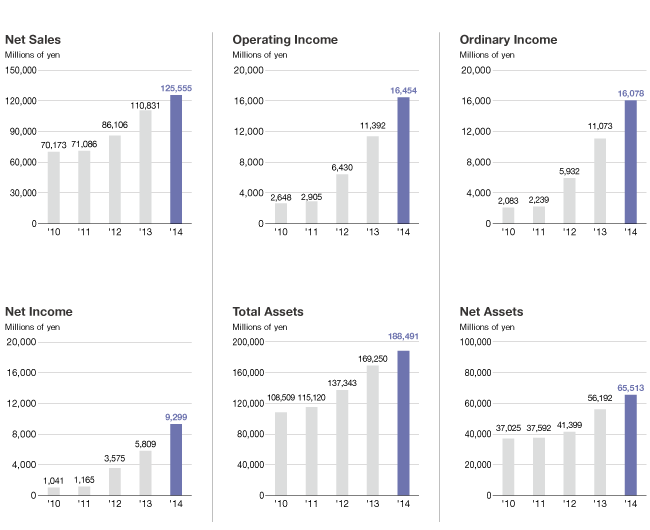
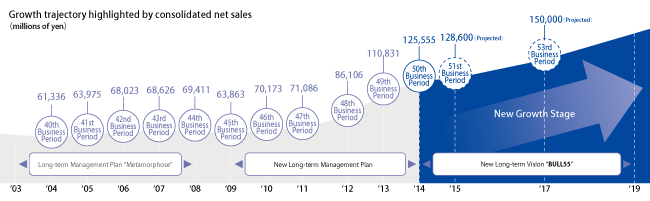
Consolidated Financial Highlights
| Millions of yen |
Thousands of U.S. dollars (Note) |
||
|---|---|---|---|
| 2013 | 2014 | 2014 | |
Consolidated operating results |
|||
| Net sales | ¥ 110,831 | ¥ 125,555 | $ 1,148,301 |
| Operating income | 11,392 | 16,454 | 150,489 |
| Ordinary income | 11,073 | 16,078 | 147,049 |
| Net income | 5,809 | 9,299 | 85,046 |
| ROE | 12.3% | 15.8% | 15.8% |
| Dividend payout ratio | 11.4% | 13.6% | 13.6% |
| Plant and equipment investment | 28,348 | 30,625 | 280,098 |
Consolidated financial position |
|||
| Total assets | 169,250 | 188,491 | 1,723,903 |
| Net assets | 56,192 | 65,513 | 599,172 |
| Equity ratio | 32.2% | 33.6% | 33.6% |
Consolidated cash flows |
|||
| Net cash provided by (used in) operating activities | 20,759 | 24,782 | 226,657 |
| Net cash provided by (used in) investing activities | –1,117 | -3,374 | -30,866 |
| Net cash provided by (used in) financing activities | –6,532 | -22,405 | -204,919 |
| Cash and cash equivalents at end of period | 32,957 | 31,980 | 292,486 |
Information per share of common stock |
yen | U.S. dollars (Note) | |
|---|---|---|---|
| Net income | ¥ 175.50 | ¥ 258.02 | $ 2.35 |
| Net assets | 1,513.49 | 1,758.24 | 16.08 |
| Dividends per share | 20.00 | 35.00 | 0.32 |