Warning: include(/home/c9205967/public_html/kanamoto.ne.jp/include/menu_50semiannual_en.php): Failed to open stream: No such file or directory in /home/c9205967/public_html/kanamoto.ne.jp/en/pub/50/semiannual/03/index.html on line 109
Warning: include(): Failed opening '/home/c9205967/public_html/kanamoto.ne.jp/include/menu_50semiannual_en.php' for inclusion (include_path='.:/opt/alt/php82/usr/share/pear:/opt/alt/php82/usr/share/php:/usr/share/pear:/usr/share/php') in /home/c9205967/public_html/kanamoto.ne.jp/en/pub/50/semiannual/03/index.html on line 109
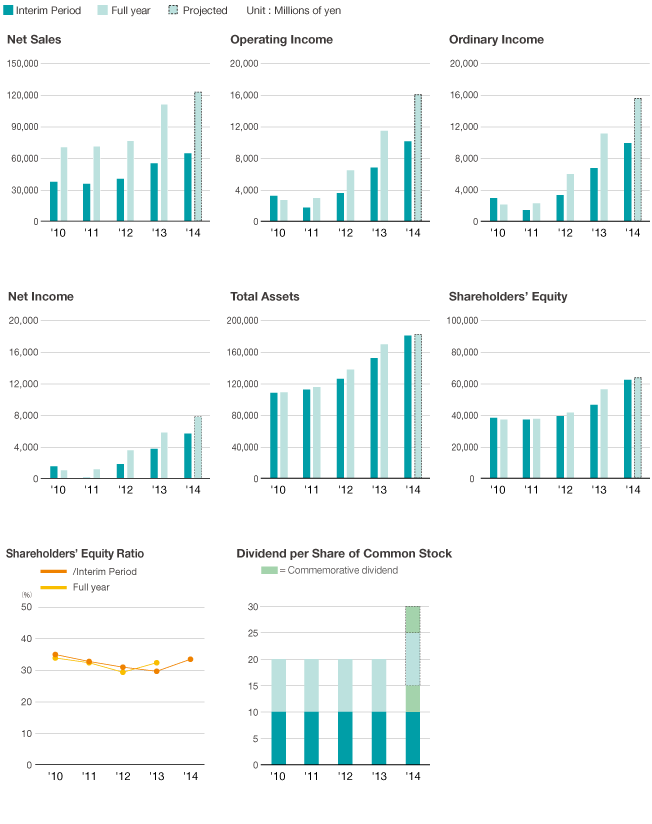
Consolidated Financial Highlights
| Millions of yen | Thousands of U.S. dollars (Note) |
||
|---|---|---|---|
| April 30, 2013 | April 30, 2014 | April 30, 2014 | |
Consolidated operating results |
|||
| Net sales | ¥54,733 | ¥64,212 | $625,789 |
| Operating income | 6,751 | 10,072 | 98,159 |
| Ordinary income | 6,714 | 9,860 | 96,092 |
| Net income | 3,716 | 5,651 | 55,079 |
| Comprehensive income | 5,212 | 6,228 | 60,699 |
Consolidated financial position |
|||
| Total assets | 151,668 | 180,252 | 1,756,679 |
| Shareholders’ equity | 46,376 | 62,119 | 605,391 |
| Shareholders’ equity ratio | 29.5% | 33.3% | 33.3% |
Consolidated cash flows |
|||
| Net cash provided by (used in) operating activities | 11,198 | 16,668 | 162,441 |
| Net cash provided by (used in) investing activities | -159 | -2,456 | -23,937 |
| Net cash provided by (used in) financing activities | -4,796 | -13,509 | -131,655 |
| Cash and cash equivalents at end of period | 26,045 | 33,672 | 328,163 |
Information per share |
Yen | U.S. dollars (Note) | |
|---|---|---|---|
| Net income | ¥113.20 | ¥156.82 | $1.52 |
| Dividends per share | 10.00 | 15.00 | 0.15 |
Financial Topics
Net Sales
As a result of concentrating management resources in the Tohoku Region where manpower and construction equipment are insufficient, to help achieve restoration of the disaster-stricken region as quickly as possible, together with creating a strong sales and marketing organization and working to strengthen sales in cooperation with other Kanamoto Group firms, net sales in all regions of Japan were higher than in the same period of the prior business period.
Earnings
As a result of working tirelessly to improve its operating performance, including improvement of profit margins through optimization of asset utilization and the strengthening of its business structure and financial position, Kanamoto was able to achieve operating income, ordinary income and net income that were significantly higher than in the same period of the prior fiscal year.