Ten-Year Summary (Consolidated)
Scroll to the right, to see the following columns →
| Millions of yen | Thousands of U.S. dollars (Note) |
||||||||||
|---|---|---|---|---|---|---|---|---|---|---|---|
| 2009 | 2010 | 2011 | 2012 | 2013 | 2014 | 2015 | 2016 | 2017 | 2018 | 2018 | |
Consolidated operating results |
|||||||||||
| Net sales | 63,863 | 70,173 | 71,086 | 86,106 | 110,831 | 125,555 | 133,292 | 144,870 | 158,428 | 168,188 | 1,484,978 |
| Operating profit | 137 | 2,648 | 2,905 | 6,430 | 11,392 | 16,454 | 16,270 | 15,134 | 16,665 | 17,599 | 155,392 |
| Ordinary profit | ー 222 | 2,083 | 2,239 | 5,932 | 11,073 | 16,078 | 16,164 | 14,405 | 17,193 | 17,925 | 158,269 |
| Profit attributable to owners of parent | ー 1,158 | 1,041 | 1,165 | 3,575 | 5,809 | 9,299 | 9,557 | 8,098 | 10,744 | 11,857 | 104,693 |
| Plant and equipment investment | 13,677 | 12,172 | 16,798 | 21,814 | 28,348 | 30,625 | 27,639 | 29,441 | 26,584 | 35,136 | 310,233 |
Consolidated financial position |
|||||||||||
| Total assets | 96,435 | 108,509 | 115,120 | 137,343 | 169,250 | 188,491 | 202,919 | 220,836 | 227,545 | 241,578 | 2,132,955 |
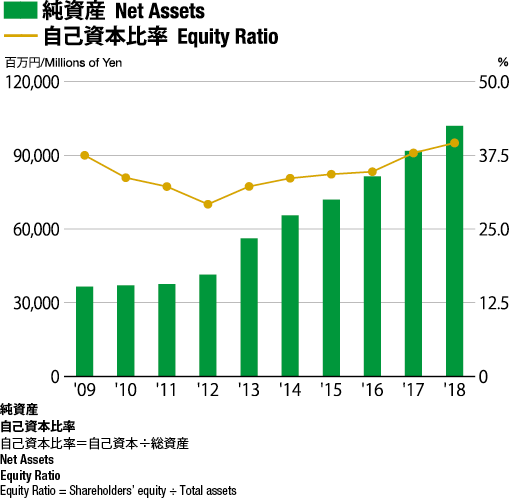
| Net assets | 36,541 | 37,025 | 37,592 | 41,399 | 56,192 | 65,513 | 71,998 | 81,434 | 91,788 | 102,031 | 900,858 |
Consolidated cash flows |
|||||||||||
| Net cash provided by (used in) operating activities | 2,076 | 9,088 | 6,903 | 14,306 | 20,759 | 24,782 | 33,509 | 26,618 | 37,788 | 35,421 | 312,741 |
| Net cash provided by (used in) investing activities | ー 3,192 | 101 | ー 1,013 | ー 835 | ー 1,117 | ー 3,374 | ー 4,488 | ー 8,940 | ー 4,747 | ー 6,980 | ー 61,633 |
| Net cash provided by (used in) financing activities | ー 2,439 | ー 2,737 | ー 6,262 | ー 14,074 | ー 6,532 | ー 22,405 | ー 24,857 | ー 20,726 | ー 30,960 | ー 26,858 | ー 237,137 |
| Cash and cash equivalents at end of period | 14,086 | 20,751 | 20,374 | 19,717 | 32,957 | 31,980 | 36,150 | 33,069 | 35,160 | 36,733 | 324,325 |
Scroll to the right, to see the following columns →
| 2009 | 2010 | 2011 | 2012 | 2013 | 2014 | 2015 | 2016 | 2017 | 2018 | 2018 | |
|---|---|---|---|---|---|---|---|---|---|---|---|
| yen | U.S. dollars (Note) |
||||||||||
Information per share of common stock |
|||||||||||
| Net income per share | ー 35.28 | 31.73 | 35.51 | 108.88 | 175.50 | 258.02 | 266.27 | 229.16 | 304.05 | 335.54 | 2.96 |
| Net assets per share | 1,102.51 | 1,112.46 | 1,129.47 | 1,221.56 | 1,513.49 | 1,758.24 | 1,969.16 | 2,169.93 | 2,440.41 | 2,707.49 | 23.90 |
| Dividends per share | 20.00 | 20.00 | 20.00 | 20.00 | 20.00 | 35.00 | 35.00 | 45.00 | 50.00 | 60.00 | 0.52 |
| Dividend payout ratio | − | 63.0% | 56.3% | 18.4% | 11.4% | 13.6% | 13.1% | 19.6% | 16.4% | 17.9% | 17.9% |
Scroll to the right, to see the following columns →
| 2009 | 2010 | 2011 | 2012 | 2013 | 2014 | 2015 | 2016 | 2017 | 2018 | 2018 | |
|---|---|---|---|---|---|---|---|---|---|---|---|
| Millions of yen | Thousands of U.S. dollars (Note) |
||||||||||
Management index |
|||||||||||
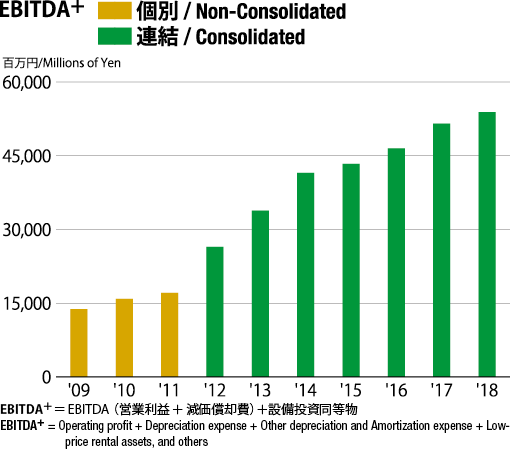
| EBITDA+ | 13,801 | 15,898 | 17,083 | 26,456 | 33,854 | 41,503 | 43,328 | 46,530 | 51,545 | 53,863 | 475,576 |
| Equity ratio | 37.5% | 33.7% | 32.2% | 29.2% | 32.2% | 33.6% | 34.3% | 34.7% | 37.9% | 39.6% | 39.6% |
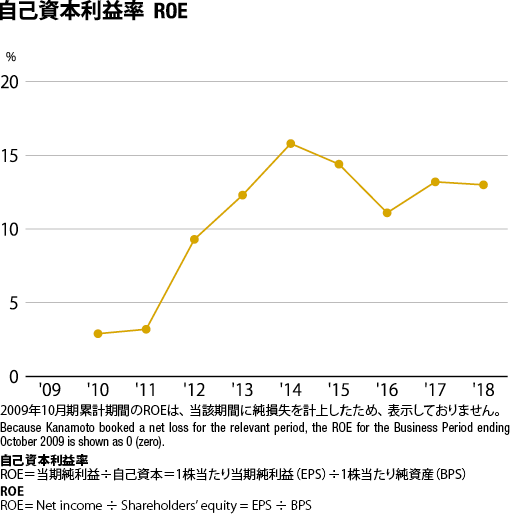
| ROE | − | 2.9% | 3.2% | 9.3% | 12.3% | 15.8% | 14.4% | 11.1% | 13.2% | 13.0% | 13.0% |
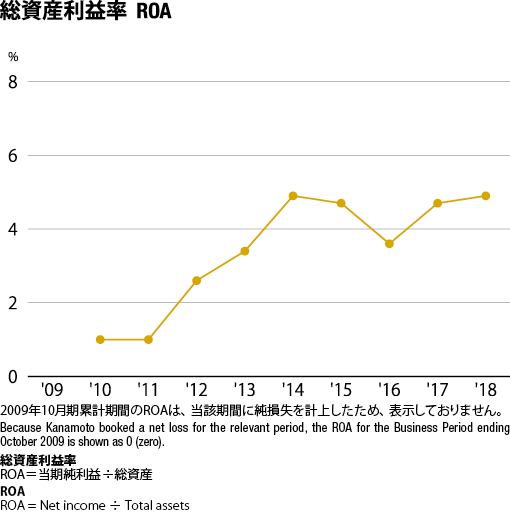
| ROA | − | 1.0% | 1.0% | 2.6% | 3.4% | 4.9% | 4.7% | 3.6% | 4.7% | 4.9% | 4.9% |