Warning: include(/home/c9205967/public_html/kanamoto.ne.jp/include/menu_54semiannual_en.php): Failed to open stream: No such file or directory in /home/c9205967/public_html/kanamoto.ne.jp/en/pub/54/semiannual/03/index.html on line 107
Warning: include(): Failed opening '/home/c9205967/public_html/kanamoto.ne.jp/include/menu_54semiannual_en.php' for inclusion (include_path='.:/opt/alt/php82/usr/share/pear:/opt/alt/php82/usr/share/php:/usr/share/pear:/usr/share/php') in /home/c9205967/public_html/kanamoto.ne.jp/en/pub/54/semiannual/03/index.html on line 107
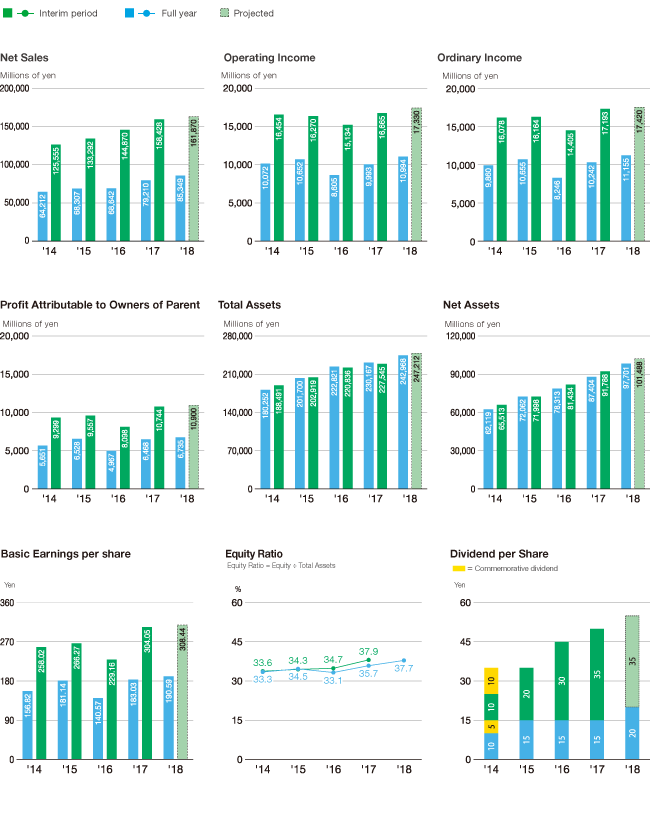
Consolidated Financial Highlights
| Millions of yen | Thousands of U.S. dollars (Note) |
||
|---|---|---|---|
| April 30, 2017 | April 30, 2018 | April 30, 2018 | |
Consolidated operating results |
|||
| Net sales | ¥ 79,210 | ¥ 85,349 | $ 780,520 |
| Operating income | 9,993 | 10,994 | 100,545 |
| Ordinary income | 10,242 | 11,155 | 102,016 |
| Profit attributable to owners of parent | 6,468 | 6,735 | 61,592 |
| Comprehensive income | 7,053 | 7,171 | 65,586 |
Consolidated financial position |
|||
| Total assets | 230,167 | 242,968 | 2,221,931 |
| Net assets | 87,404 | 97,701 | 893,475 |
| Equity ratio | 35.7% | 37.7% | 37.7% |
Consolidated cash flows |
|||
| Net cash provided by (used in) operating activities | 24,114 | 22,716 | 207,743 |
| Net cash provided by (used in) investing activities | -1,409 | -4,562 | -41,727 |
| Net cash provided by (used in) financing activities | -15,627 | -13,250 | -121,171 |
| Cash and cash equivalents at end of period | 40,154 | 40,063 | 366,380 |
Information per share |
Yen | U.S. dollars (Note) | |
|---|---|---|---|
| April 30, 2017 | April 30, 2018 | April 30, 2018 | |
| Basic earnings per share | ¥ 183.03 | ¥ 190.59 | $ 1.74 |
| Dividends per share | 15.00 | 20.00 | 0.18 |
Financial Topics
During the interim period of the current consolidated fiscal year the Company was able to substantially increase net sales, and from an earnings perspective maintained earnings growth momentum as well. This was accomplished by pursuing branch development centered on the Tokyo metropolitan area and regions of western Japan where the Company has not had a strong presence in the past, and executing actions such as measures to strengthen Kanamoto’s group strategy, broaden its operating base, maintain and enhance its support organization for disaster recovery and reconstruction activities, and improve utilization ratios through optimal repositioning of rental equipment. The Company also continued to smoothly and systematically conduct used construction equipment sales against the backdrop of an excellent market environment.